Market watch
Better times ahead for China equities?
Issue date: 2022-09-30
abrdn
After significant weakness earlier in 2022, both onshore and offshore Chinese equity markets have recently bounced back strongly.
In the period from the end of April to 22 July, the Shanghai A-share Index outperformed the S&P 500 by 11% and the MSCI Emerging Markets Index by 15%. This rebound came after Chinese equities had underperformed for much of the previous year, following the ‘Common Prosperity’ drive started in summer 2021.
The important question for investors now is – can this improvement be sustained?
Drivers of earlier weakness
A challenging economic backdrop has weighed on Chinese equites since late 2021. The latest consensus expectation is that China’s economic growth will halve to 4.2% in 2022 from 8.4% in 20211. This marked slowdown reflects the country’s ongoing real estate downturn and the ‘zero-covid policy’, which has resulted in damaging lockdowns in major commercial centres like Shanghai and Shenzhen. China equity investors have also had to contend with unhelpful regulatory conditions, both home and abroad.
Easing headwinds
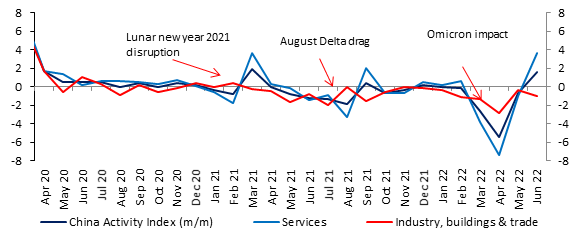
The recent strong rally and outperformance of China equities has been driven by a moderation of some key headwinds. On the covid front, China’s zero tolerance approach has been effective in reducing the number of new cases very significantly – the 7-day average of daily new cases was less than 1,000 as of 24 July, which is a small fraction of the recent mid-April 2022 high of nearly 30,000 cases. This has enabled some controls to be relaxed, including less stringent quarantine rules. As shown below, this is reflected in an uptick in Chinese economic activity of late.
Recovering China economic activity

On the regulatory side, there have also been clear signs of the new regime bedding down, allowing some easing of pressures. For example in late June, some popular online platforms, such as Manbang and Boss Zhipin, announced the resumption of new user registrations.
Comparatively helpful policy backdrop
Another contributor to improved performance lately has been China’s comparatively much more helpful monetary and fiscal backdrop. Unlike virtually all other major central banks, the People’s Bank of China has not felt the need to join the global trend of sharply raising policy interest rates. On the contrary, since the start of 2022, it has eased policy on multiple occasions through a combination of interest rate and reserve requirement cuts. This markedly different monetary stance has been enabled by comparatively very low inflation in China, which was running at just 2.5% year-on-year in June.
On the fiscal front too, policy in China is more supportive compared to the rest of the world at present. For example, our economists think infrastructure spending especially could get a significant boost from efforts to bring forward local government bond issuance.
Valuations not prohibitive for further outperformance
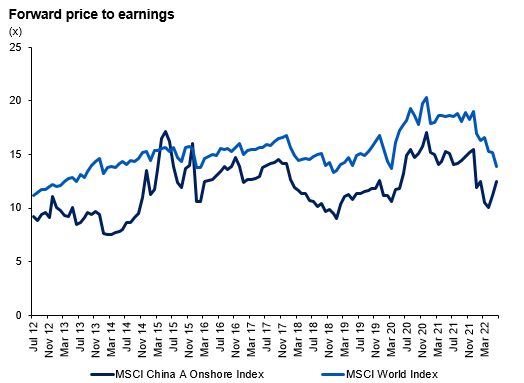
Despite the recent rally, the valuation of China equities remains more attractive compared to many global equity markets. For example, the MSCI China A Index forward price-earnings (PE) ratio of 11.1 suggests significant cheapness compared to the MSCI US Index and MSCI All Countries World Index, which have forward PE ratios of 16.3 and 14.2 respectively2.

“Despite the recent rally, the valuation of China equities remains more attractive compared to many global equity markets.”
At the same time, the forward earnings projections for China corporates seem more than adequate – for 2023, consensus estimates are for 7% revenue growth and 4.7% net margin, which would produce 15% earnings-per-share growth, relative to the expected lower base of 20223.
Risk factors
However, optimism regarding the outlook for China equities should be qualified by respect for some quite weighty risk factors. Firstly, while restrictions have been incrementally easing in the past two months, the dynamic zero-Covid policy has not been discarded. This means that new restrictions are still possible, although a crucial difference we think will be that future lockdowns should be much more targeted and adaptive.
Secondly, the important property sector, which by some estimates, together with related services accounts for around 25-30% of China’s GDP4, remains a headwind. Until further deleveraging is completed, the sector will probably remain vulnerable to adverse news flow. Recently for example, concerns have been rising that mortgage defaults could rise owing to a wave of homeowners joining a nationwide mortgage payment boycott for unfinished homes. However, given potential contagion risk, we expect the authorities to be very proactive in addressing this issue.
Putting everything together
Putting everything together, we think there are enough reasons to be relatively optimistic regarding the outlook for Chinese equities. In particular, the combination of the easing covid restrictions, easing regulatory pressures, accommodative monetary and fiscal policy, as well as relatively undemanding valuations, suggest scope for continued outperformance. However, optimism should be tempered by due appreciation of the risks, especially regarding the dynamic covid policy and unresolved stresses in the key real estate sector.
Overall, we think the present environment underscores the need for a selective investing approach that favours Chinese companies with attractive fundamentals, low exposure to the macro risk factors and undemanding valuations.
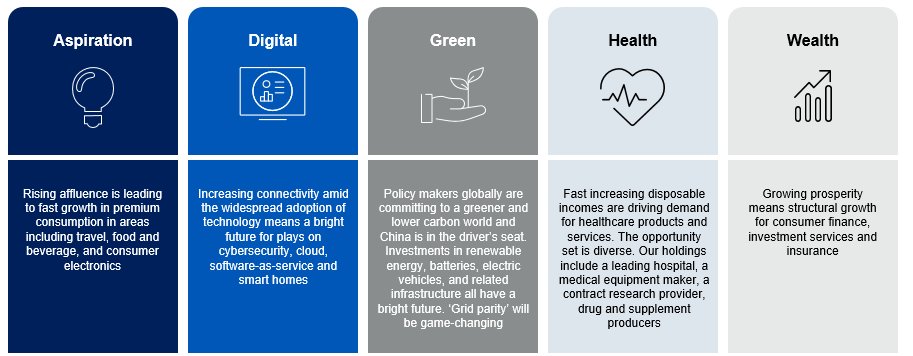
We have positioned our equity portfolios around the following five themes that we think will enjoy government support.

Past performance is not a guide for future returns.
References
1 Consensus Economics, 11 July 2022
2 ‘Global Index Briefing: MSCI Forward P/Es’, Yardeni Research Inc., 19 July 2022
3 China Equity Strategy - Bullish 2H22 outlook on macro & micro, J.P.Morgan, 22 June 2022
4 The Economic Time, 23 July 2022
Important Information abrdn is a global business providing a range of services to help clients and customers plan, save and invest. abrdn group uses different legal entities to meet different client and customer needs. Some elements of the abrdn client experience may contain previous brand names until all brand name changes have completed. This document is strictly for informational purposes only and does not constitute an offer to sell, or solicitation of an offer to purchase any security, nor does it constitute investment advice, investment recommendation or an endorsement with respect to any investment products. Investment involves risk. The value of investments and the income from them can go down as well as up and investors may get back less than the amount invested. Past performance is not a guide to future performance. No liability whatsoever is accepted for any loss arising from any person acting on any information contained in this document Any data contained herein which is attributed to a third party (“Third Party Data”) is the property of (a) third party supplier(s) (the “Owner”) and is licensed for use by abrdn**. Third Party Data may not be copied or distributed. Third Party Data is provided “as is” and is not warranted to be accurate, complete or timely. To the extent permitted by applicable law, none of the Owner, abrdn** or any other third party (including any third party involved in providing and/or compiling Third Party Data) shall have any liability for Third Party Data or for any use made of Third Party Data. Neither the Owner nor any other third party sponsors, endorses or promotes the fund or product to which Third Party Data relates. **abrdn means the relevant member of abrdn group, being abrdn plc together with its subsidiaries, subsidiary undertakings and associated companies (whether direct or indirect) from time to time. Bloomberg data are for illustrative purposes only. No assumptions regarding future performance should be made. The MSCI information may only be used for your internal use, may not be reproduced or redisseminated in any form and may not be used as a basis for or a component of any financial instruments or products or indices. None of the MSCI information is intended to constitute investment advice or a recommendation to make (or refrain from making) any kind of investment decision and may not be relied on as such. Historical data and analysis, should not be taken as an indication or guarantee of any future performance analysis forecast or prediction. The MSCI information is provided on an “as is” basis and the user of this information assumes the entire risk of any use made of this information. MSCI, each of its affiliates and each other person involved in or related to compiling, computing or creating any MSCI information (collectively, the “MSCI” Parties) expressly disclaims all warranties (including without limitation, any warranties of originality, accuracy, completeness, timeliness, non-infringement, merchantability and fitness for a particular purpose) with respect to this information. Without limiting any of the foregoing, in no event shall any MSCI Party have any liability for any direct, indirect, special, incidental, punitive, consequential (including, without limitation, lost profits) or any other damages (www.msci.com). |